Bienvenue à la CAHL
La Ligue adulte de hockey de Chelsea (CAHL) est une ligue récréative ancrée dans la communauté de Chelsea et dans les Collines de l'Outaouais.
This site is the home base for the schedules, standings, team rosters, and the living archive of the league.
Début de la saison d’été 2026 /
Start of the Summer 2026 season: 7-May-26
Frais / Fees: TBD
Start of the Summer 2026 season: 7-May-26
Frais / Fees: TBD
Tournoi de Noël / Christmas tournament
(benefit for the QUAIL House): 27-Dec-26
(benefit for the QUAIL House): 27-Dec-26
2025-26 CAHL Winter Champions
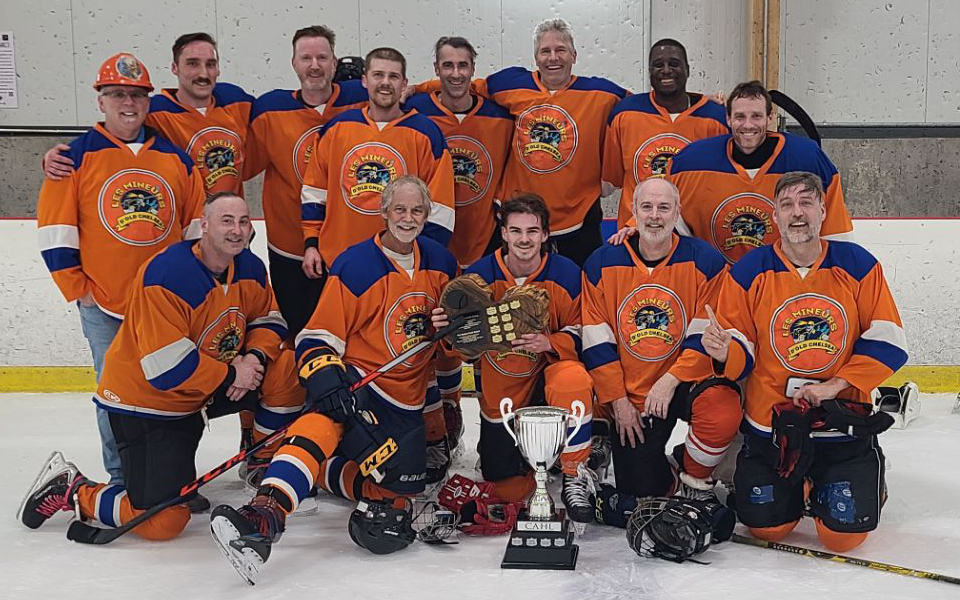
Félicitations aux Mineurs de Old Chelsea!
(rangée du haut: T. McLaughlin, A. Waddington, G. Brayford, J. Flood, D. Jones, V. Jung, H. Shaw, K. Molloy; rangée du bas: B. Jones, B. Flood, L. Flood, N. Parry, B Stewart)
Classement d’été 2026 de la CAHL
| Équipe | GP | W | L | T | Pts | GF | GA | Diff |
|---|
Chargement du classement...
Tie-Break Procedure
- Most wins
- Goal differential
- Head-to-head record
- Goals for
- Fewest goals against
- Coin toss, shoe toss, or rock-paper-scissors at the commissioner’s discretion